
AI + Custom Software for Utilities
Every sample, reading, and result in place before the report is due.
Lab results arrive as emailed PDFs. Flow data sits in the historian. The permit sits in a binder, and the rounds sheets sit on a clipboard. At most utilities, one or two people pull it all together by hand every month, and they’re the same people the plant needs most.
That gap between systems is where water quality data management software earns its keep. We build tools that check scheduled samples against what was collected, match lab results to sample points, turn rounds sheets into data, and draft monthly report values with the math shown, for drinking water and wastewater utilities alike.
SCADA keeps running the process. Your compliance manager, lab supervisor, and chief operator get their week back, and your operator still reviews and signs every report.

Common utility problems
Common AI and automation opportunities in water & wastewater
The plant runs around the clock. The reporting around it still runs on spreadsheets, binders, and the memory of whoever has been there longest.
Sampling & Lab Results
Did we pull every sample we owed this month?
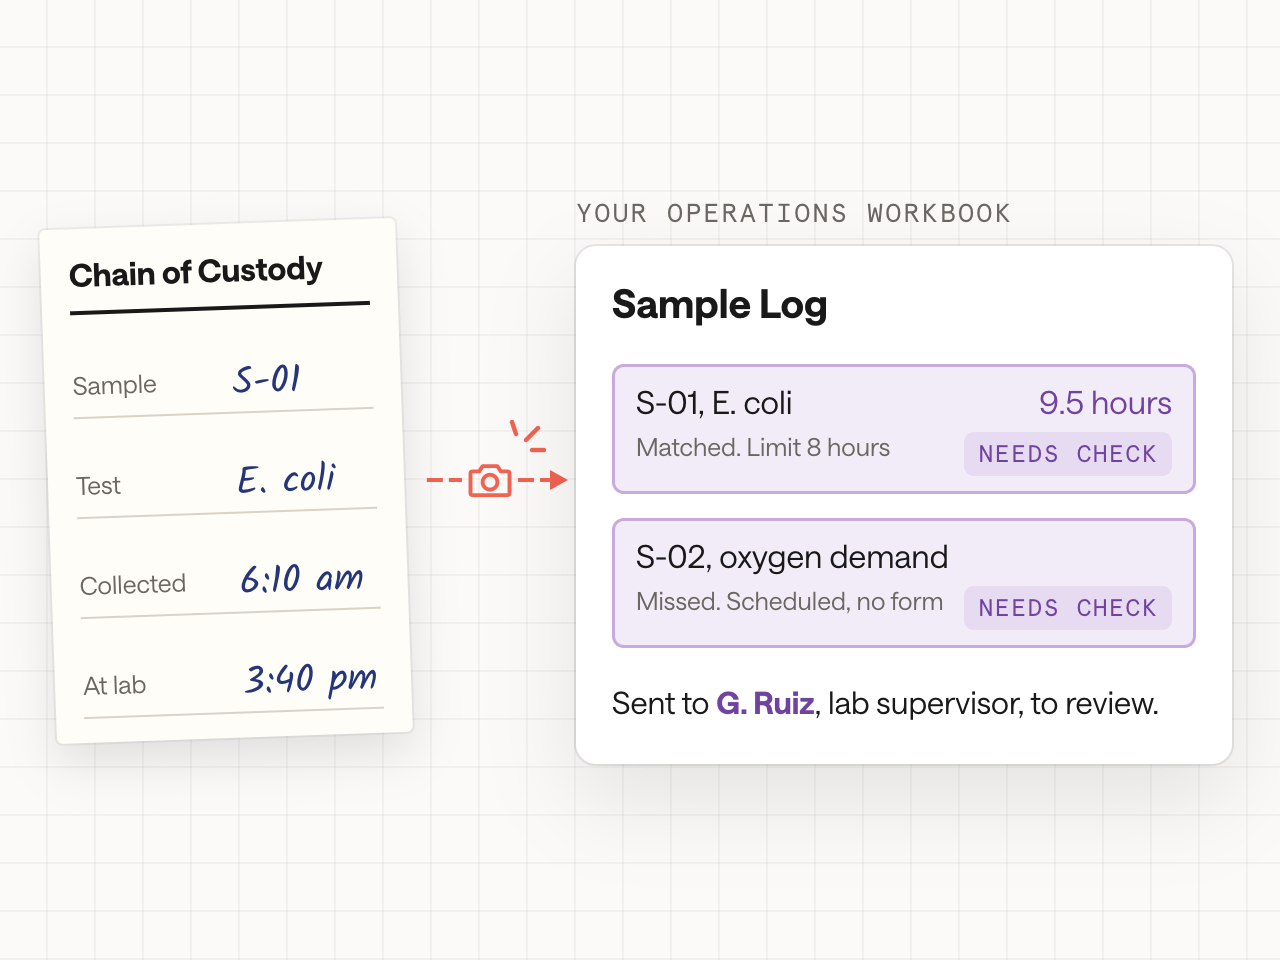
Operators pull composite and grab samples on schedule, fill out the chain of custody form, and send some to the in-house lab and some to a contract lab. Results come back as PDFs or spreadsheets, get typed into the operations workbook, and get multiplied by historian flows for loadings. A missed sample often turns up at month end.
We build water quality data management that checks each scheduled sample against what was collected, matches lab results to sample point and date, and flags a missed sample or a hold-time problem while there’s still time to resample. Your lab supervisor reviews each flag.
Rounds Sheets & Field Logs
The readings are on a clipboard. The report needs them in a spreadsheet.
Operators walk rounds with a clipboard: chlorine residuals, pH, meter readings, and equipment checks. At shift change the sheets go into a binder. Later, someone types them into the operations workbook one cell at a time, squinting at handwriting and guessing at a smudged decimal.
It works like operator rounds software, with the clipboard staying put: a phone photo turns each sheet into structured data tied to the right location, date, and operator. Readings outside their normal range are flagged for the shift lead, and the numbers reach the monthly report and the trend charts without anyone retyping them.
DMRs & Monthly Reports
Month end means days of reassembling the month.
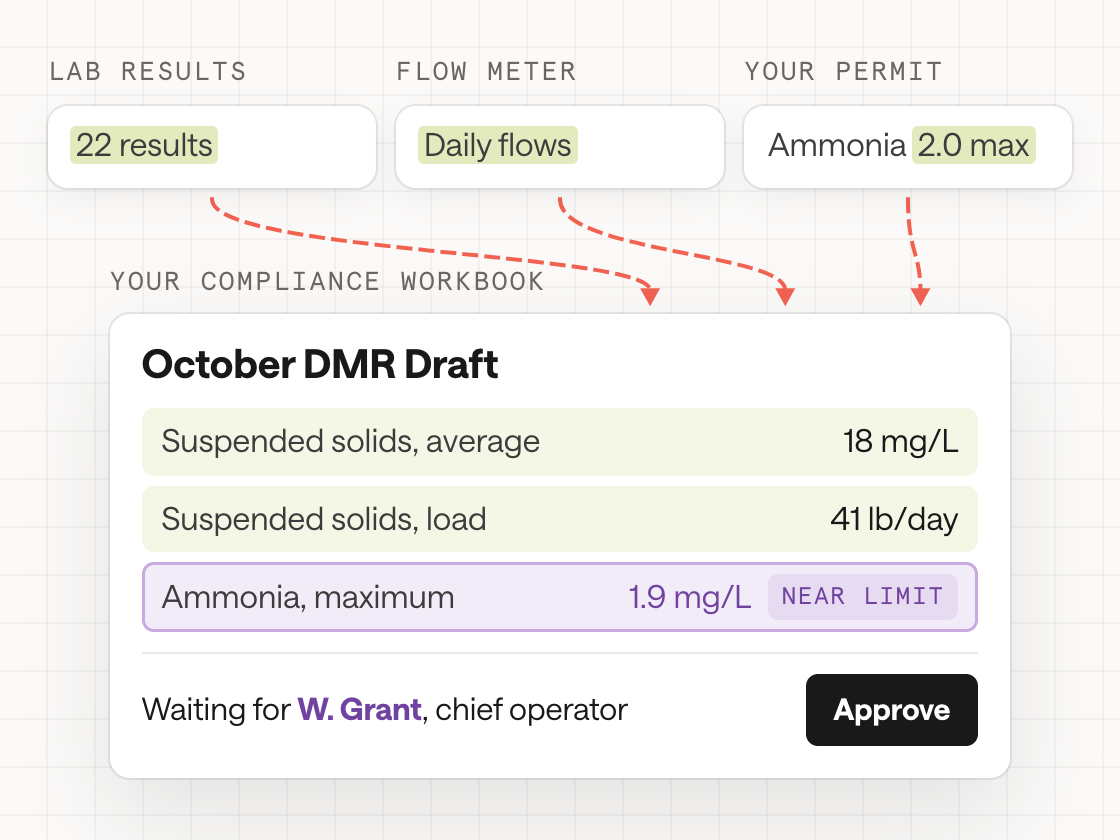
Your compliance manager pulls lab results, operator logs, and flow data, computes averages, maximums, and loadings for every parameter, checks each against the permit, and writes up any exceedance. Then it all gets entered into the state or EPA reporting portal, and the monthly operating report comes next.
We build DMR reporting tools that draft each discharge monitoring report value with the calculation behind it, mark results near a permit limit, and note where a no-data code or explanation is needed. Your operator in responsible charge reviews, corrects, and signs, then submits through the portal you already use.
Utility software
Where custom software fits around your water utility software
Most of the friction sits between your SCADA system and your LIMS. Good water utility software or wastewater treatment plant software for this job usually starts small: one plant, one permit, or one monthly report, built on sample data first and connected once your staff approves it.
Permit Obligation Tracking
Effluent limits, monitoring frequencies, and schedule dates are read from the permit into a list your compliance manager confirms. Each obligation gets an owner, a due date, and the sample or record that satisfies it, and a reissued permit arrives as a list of what changed.
Sampling Schedules and Lab Results
Sampling plans, custody forms, and results from your own lab or a contract lab land in one place, matched to sample point and date. Missed samples and hold-time problems surface the day they happen, while there’s still time to go back out and pull another sample.
Rounds Sheets and Field Data
Rounds sheets, field test logs, and meter readings can stay on clipboards if that’s what works. A phone photo turns each sheet into structured data tied to the right location and date, so readings reach the monthly report and the trend charts without anyone retyping them.
DMR and Monthly Report Drafting
Discharge monitoring reports, monthly operating reports, and annual reports are drafted from lab results and historian data, with every calculation shown. Values near a limit are marked for review.
Operator Knowledge and SOP Search
When a senior operator retires, much of the plant’s history leaves too. Source-cited answers from SOPs, O&M manuals, past permit letters, and inspection reports keep that knowledge searchable for the next shift and the next new hire, scoped to what each person may see.
Exceptions Across Plant Systems
A pump outage in the CMMS, a flow spike in the historian, and a high lab result are often one event recorded in three places. We connect them so the exception surfaces early, with the related records attached, for an operator or lab supervisor to review and decide on.




How we work with water & wastewater utilities
Utilities buy carefully, and we plan around that. We start small, with one plant, one permit, or one monthly report, scoped in writing so it can move through your purchasing process. If it helps, you gather the permit, last month’s DMR, and a few lab reports. Then we watch the work, from the sampling run to the signed report.
Then we think it through: what can be automated, what an operator or lab supervisor has to decide, and which systems stay untouched. You see a working prototype on sample data before anything connects to your historian or LIMS. Once your staff approves it, we connect it to your real systems and go live. We work within and around those systems, from Esri ArcGIS and Cityworks to IBM Maximo.
Records & control
Reporting help can't put the control room at risk.
A utility’s first job is safe water and a permitted discharge. A reporting tool has no business near the systems that run the process, so we build around them: the tools read and reconcile, while operators run the plant and sign the reports.
SCADA stays in charge of the process
Reporting tools read data from the historian and the systems around it. Control of the process stays with SCADA and your operators, and the line between control systems and business systems stays where your operations and IT staff drew it.
Operators sign what goes to the regulator
The tools draft reports and show their math. The operator in responsible charge, or whoever your permit names, reviews, corrects, and signs. Nothing goes to a state or EPA portal unless a person on your staff reviews it and sends it.
Each number traces to its source
Every value in a draft report links back to the lab result, field reading, or historian tag it came from. When your regulator asks about a number, the answer starts with a click instead of an afternoon searching through binders and old workbooks.
A permanent record of who signed off
Records and compliance reporting can be traced with a permanent record system: who did what, when, and who signed off, from the sample bottle to the submitted report. Your staff decides what goes into that record and who is allowed to see it.
Water utilities operate under federal and state frameworks, including the Safe Drinking Water Act and the Clean Water Act’s NPDES program, with reporting through state primacy programs and EPA systems. What a utility owes depends on its permits, its state, and its system, so we treat your permit as the source of truth for what’s required. What we build supports work that your compliance manager, operators, and superintendent own. Interpreting a permit condition, deciding whether something is a violation, and answering the regulator stay with them.
FAQ
Water quality data management: common questions
What is a discharge monitoring report (DMR)?
A discharge monitoring report is the periodic report a permitted facility submits to show what it discharged: the parameters it sampled, the measured values and loadings, and any exceedances, as its NPDES permit requires. Most DMRs are now filed electronically through EPA’s NetDMR or a state system. We can draft the values with the math shown; your operator reviews, signs, and submits.
Can AI help with DMR reporting without replacing our current software?
Yes. Good wastewater reporting software pulls from systems you already have: lab results, the historian, and the operations workbook. We build the layer that gathers those numbers, does the calculations, and marks anything near a limit, so the report starts as a checked draft instead of a blank form. Your existing systems stay in place.
Does anything you build control the treatment process?
No. Process control stays with SCADA and your operators. Our tools read data from the historian and the systems around it for sampling, records, and reports. Which data is read, and how access is set up, is agreed with your operations and IT staff before anything connects.
How do you handle results from a contract lab?
Contract lab results usually arrive by email as PDFs or spreadsheets. We read each report, match the results to the sample point, date, and parameter in your sampling plan, and flag anything missing, late, or past its hold time. It works alongside any water sampling software you already use. Your lab supervisor reviews the flags, and nothing is changed without a person.
What is water quality data management?
Water quality data management means keeping sample results, field readings, and process data organized, checked, and ready for reports and trend reviews. At most utilities, wastewater lab data management is spread across a LIMS, spreadsheets, and paper. The water quality data management software we build connects those sources so each number is checked once and reused wherever it’s needed.
Can you help with NPDES permit tracking?
Yes. Effluent limits, monitoring frequencies, and compliance schedule dates can be read from the permit into a tracked list that your compliance manager confirms line by line. Interpreting a permit condition, and deciding what it requires, stays with your staff and your regulator.
Do you work with small water systems?
Yes. Small systems, from a package wastewater treatment plant to a rural drinking water system, often have one or two people covering operations, lab work, and reporting, which is exactly where retyping hurts most. We start with one report or one plant, scoped in writing to fit your purchasing process, and grow only if the first piece earns its keep.
You know AI could help. Let’s build it.
Bring us a task you have in mind, or just a hunch. We’ll help you find the right place to start and build it around the way your business works.